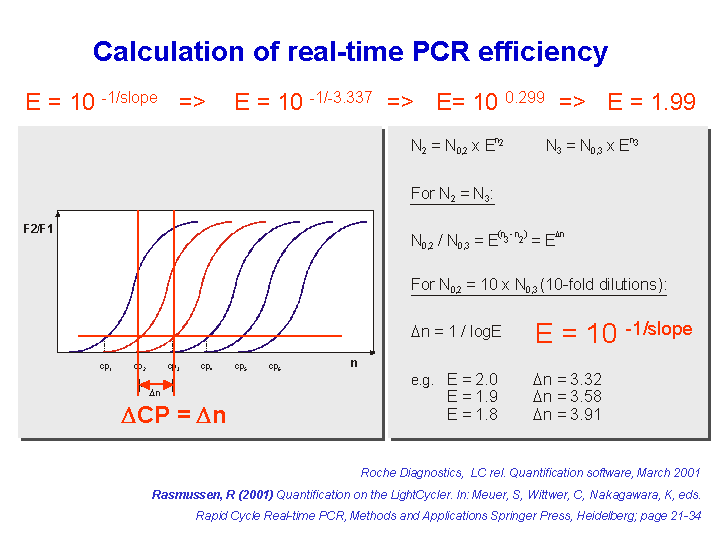
Estimation via "calibration dilution curve and slope calculation"

real-time PCR efficiency:    E  =  10^[–1/slope]

Efficiency of PCR Reactions
Mx4000 Application Note #10  by Stratagene


4 parametric sigmoidal model

Model is described by equation [1]. One fluorescence data set from this study was used as an example. In this model, y0 is the ground fluorescence, a is the difference between maximal fluorescence acquired in the run and the ground fluorescence,  x0 is the first derivative maximum of the function or the inflexion point of the curve and b describes the slope of curve.

equation [1]


Figure:    Plot of fluorescence observations from LightCycler (Roche Diagnostics). Forty observations give a sigmoid trajectory that can be described by full data fit (four parametric logistic model). Ground phase can be well linearly regressed (inlay). Following data of n > 7 are considered exponentially behaved and can be fitted by exponential model. Various model fits are designated in legend within figure. FDM and SDM denote position of first and second derivative maximum within full data fit.

©  editor@gene-quantification.info